Ever grabbed what looked like a massive bag of chips only to find it half-empty when you tore it open? You’re not alone.
Chip bag sizes confuse millions of shoppers daily because what you see rarely matches what you get.
The $28 billion US snack food industry knows exactly what it’s doing. Those bags aren’t accidentally oversized. Every dimension serves a calculated purpose.
Standard Chip Bag Sizes: Exact Measurements That Matter
Standard chip bag sizes follow surprisingly rigid patterns across brands. Manufacturers don’t randomly pick dimensions they optimize for production lines, shipping pallets, and your psychology.
Single-Serve Bags: The Vending Machine Standard
Single-serve chip bags measuring 1 oz (28g) dominate vending machines everywhere.
These tiny packages measure exactly 3.5″ × 5″ × 1.5″. That’s roughly the size of your smartphone minus the thickness.
Inside that little bag? Just 12-15 chips. The calorie count hovers around 150-160. Your cost per ounce hits $0.75-$1.25 the most expensive way to buy chips.
Grab-and-go sizes bump up to 1.5-2 oz with dimensions of 4″ × 6.5” × 2“. Gas stations love these because they fit checkout displays perfectly.
You’ll find 20-25 chips inside and pay $0.50-$0.85 per ounce.
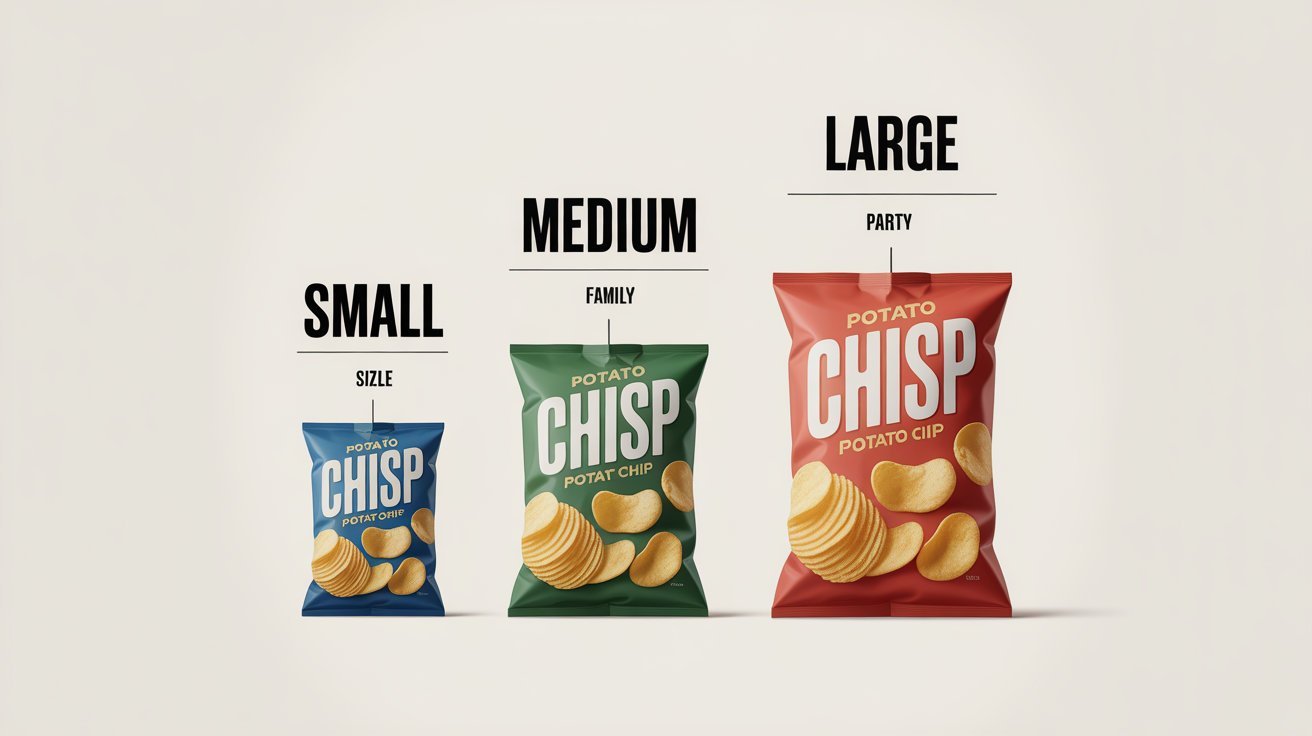
Regular Size Bags: The Grocery Store Workhorse
Regular size chip bags at 8 oz (227g) measure 8″ × 12“ × 3.5“. This classic size gets marketed as “feeds 2-3 people” but realistically serves 1-2.
Potato chip bag dimensions for this size hold approximately 85-100 chips. Total calories reach 1,200-1,280. Cost per ounce drops to $0.35-$0.55 a significant improvement over single-serve economics.
These bags match the size of a standard magazine. Stack three smartphones and you’ve got the thickness. When emptied, the chips fill a standard cereal bowl.
Family Size Bags: The Multi-Person Household Pick
Family size chip bags ranging from 11-13 oz (312-369g) measure 9.5″ × 14” × 4.5“. Brands claim these feed 4-5 people. Reality check: they serve 2-3 at actual gatherings.
You get 130-160 chips totaling 1,600-1,950 calories. Price point packaging strategies kick in here cost per ounce drops to $0.28-$0.42. That’s 20-30% better value than regular sizes.
These bags stand as tall as a wine bottle. They fill a mixing bowl about 60% full. On shelves, one family bag takes the same space as three regular bags side-by-side.
Party Size Bags: When You’re Actually Hosting
Party size chip bags at 15-16 oz (425-454g) measure 11″ × 16″ × 5“. These actually deliver on their promise they’ll feed 6-8 people at social events.
Inside you’ll find 180-210 chips carrying 2,250-2,400 total calories. The chip bag weight efficiency shines here with cost per ounce hitting $0.22-$0.35. That’s 35-45% savings versus regular sizes.
Dimensions compare to a laptop computer. Height matches a standard shoebox. Empty one and it fills a large salad bowl. The weight feels like holding four medium apples.
The Air Myth: What’s Really Inside Those Bags
Nitrogen in chip bags isn’t a scam it’s engineering. That “empty space” serves specific purposes beyond making bags look bigger.
Actual Fill Levels Across Major Brands
Air-to-chip ratio averages 43% chips to 57% nitrogen by volume. But brands vary significantly:
| Brand | Bag Size | Listed Weight | Chip Volume % | Air Space % |
|---|---|---|---|---|
| Lay’s Classic | 8 oz | 8 oz (227g) | 41% | 59% |
| Ruffles | 8.5 oz | 8.5 oz (241g) | 45% | 55% |
| Pringles | 5.5 oz | 5.5 oz (156g) | 78% | 22% |
| Kettle Brand | 8 oz | 8 oz (227g) | 48% | 52% |
| Tostitos | 13 oz | 13 oz (369g) | 43% | 57% |
Pringles dominates efficiency because rigid cans protect chips without excess air. Flexible packaging technology in traditional bags requires more cushioning.
Why Nitrogen Matters for Freshness
Oxygen causes chips to go stale within days. Snack preservation through nitrogen flushing extends shelf life to 8-10 weeks.
The gas also cushions chips during shipping preventing the bag of crumbs phenomenon.
Slack fill packaging regulations by the FDA permit “functional slack fill” for cushioning purposes.
Companies must justify empty space as necessary for product protection.
Recent lawsuits challenged excessive ratios but manufacturers consistently prove the nitrogen serves legitimate purposes.
Real-World Comparisons You Can Actually Visualize
Chip bag comparisons work best when tied to objects you handle daily.
Measuring Without a Ruler
Your hand becomes a measurement tool. Average adult hand span stretches 8-9 inches. Index finger width measures approximately 0.75 inches. Palm area equals about 1% of total body surface area for volume estimates.
A dollar bill measures 6.14″ × 2.61” perfect for sizing small bags. Credit cards at 3.37″ × 2.125” match vending machine bag widths. Standard printer paper (8.5″ × 11″) compares to regular and family sizes.
Size Category Visual References
Single-serve bags match greeting card envelope dimensions. Ten bags stacked reach 3.5″ tall.
Regular 8 oz bags equal a standard magazine in footprint. Thickness matches three iPhones stacked. Contents fill one cereal bowl.
Family 13 oz bags match printer paper dimensions but thicker. Height equals a wine bottle standing upright. Contents fill a mixing bowl 60% full.
Party 16 oz bags approximate laptop dimensions (11″ × 14″). Height matches shoeboxes. Contents fill large salad bowls.
Manufacturing Realities Behind Those Specific Sizes
Packaging standardization doesn’t happen randomly. Production economics dictate which sizes exist.
Material Science and Construction
Chip packaging design uses multi-layer construction: polypropylene, aluminum, and polyethylene.
Total thickness ranges from 2.5-3.5 mil (0.0025-0.0035 inches). That’s thinner than a human hair but incredibly strong.
Metallized polypropylene film creates moisture and oxygen barriers. Heat seals must withstand shipping stress without bursting.
Food packaging engineering balances protection against material costs.
Production Line Constraints
Vertical form-fill-seal (VFFS) machines create bags at 60-180 per minute depending on size.
Standard widths include 3.5″, 4“, 8”, 9.5“, 11”, and 13“. Notice the pattern? Sizes jump by specific increments because retooling machines costs thousands.
Manufacturing efficiency demands weight accuracy within ±2-3% per USDA standards.
A quarter-inch dimensional change affects costs by 8-12% due to material waste and machine setup modifications.
Why don’t 9-10 oz bags exist? Because that size doesn’t align with production optimization.
The jump from 8 oz to 11-13 oz maximizes machine utilization and pallet loading efficiency.
The Psychology Behind Chip Bag Sizing
Packaging design and marketing leverage cognitive biases you don’t consciously notice.
Perceived Value Engineering
Larger bags create “better deal” perception even when per-ounce costs prove otherwise.
Consumer psychology snacks research shows visual size impacts impulse purchases more than nutrition labels or price tags.
Bags appear 30% larger than contents justify. That’s intentional. Visual impact and shelf presence drive more purchases than package efficiency.
“Shrinkflation” reduces ounces while maintaining bag dimensions. Lay’s dropped from 10 oz to 9.75 oz to 9.5 oz over five years. Same bag size. Fewer chips. Most shoppers never notice.
Portion Control Manipulation
“Single-serve” designation conflicts with reality. Studies prove 92% of people finish family size chip bags alone in one sitting. Portion control snacks marketing exploits the fact that we’ll eat whatever’s in front of us.
Resealable features increase larger bag purchases by 34%. The illusion of “I’ll save some for later” justifies buying party size instead of regular. Statistics show those resealable zippers rarely get used as intended.
Shelf Placement Strategy
Shelf presence design follows tested patterns. Eye-level shelves (4.5-5.5 feet high) exclusively hold 8-10 oz bags. Retailers know that’s where most purchase decisions happen.
Bottom shelves carry party size and bulk options. Top shelves feature specialty flavors in regular sizes. Checkout lanes? Only 1-2 oz bags because you’re making split-second decisions.
Vertical bag orientation sells better than horizontal despite identical dimensions. Why? Vertical creates perception of “more” through height psychology.
Regional and Cultural Packaging Variations
International snack packaging reveals fascinating cultural differences in snack portion sizes.
American vs. European Sizing Philosophy
United States emphasizes larger sizes. The 8-16 oz range dominates grocery stores. Party size gets normalized for routine gatherings. Individual bags stay smaller at 1-2 oz.
European chip bags (“crisps” across the pond) skew smaller. Their standard size hits 150g (5.3 oz) compared to our 8 oz. What they call “sharing bags” at 200g (7 oz) we’d consider undersized for families.
Cultural influences on packaging explain the gap. European portions emphasize moderation. American snack industry trends favor abundance and value perception.
Asian Market Packaging Precision
Japan snack packaging obsesses over single-serve perfection. Their standard size ranges 50-60g (1.7-2.1 oz).
Extreme portion control culture demands smaller packages even at higher per-ounce costs.
Resealable features appear on bags as small as 80g (2.8 oz). Premium mini bags at 30g (1 oz) sell for more per ounce than party sizes because convenience trumps efficiency.
South Korea follows similar patterns with elaborate packaging design trends featuring multiple small packages inside larger bags. You’re buying portioned servings, not bulk chips.
Environmental Impact of Different Chip Bag Sizes
Sustainable chip packaging faces serious challenges despite industry promises.
Packaging Waste by Size Category
Single-serve environmental impact hits hardest. These use 0.45g packaging per gram of chips. That’s triple the material efficiency of larger sizes.
Regular 8 oz bags improve to 0.18g packaging per gram of chips. Party 16 oz bags optimize further at 0.12g per gram. Simple math: buying one 16 oz bag versus eight 2 oz bags cuts packaging waste by 65%.
Packaging efficiency for the environment clearly favors larger sizes. But consumer behavior doesn’t always optimize for sustainability.
Recycling Challenges Nobody Mentions
Multi-layer films get rejected by 89% of municipal recycling programs. That fancy metallized film keeping chips fresh? It’s virtually unrecyclable through normal channels.
Bioplastic packaging alternatives exist but perform poorly. Current compostable materials allow moisture penetration, reducing shelf life from 10 weeks to 3 weeks. That creates food waste offsetting packaging benefits.
TerraCycle partnership programs collect chip bags from major brands. But participation remains minimal less than 0.5% of bags sold get returned.
Innovation Timeline
Sustainable design innovations target 2025-2027 for significant changes. Mono-material films promise easier recycling while maintaining barrier properties.
Right-sizing initiatives could reduce bag dimensions by 8-15% without affecting chip protection.
Refillable bulk bin programs test at select retailers. Early results show 23% adoption among environmentally-conscious consumers.
Packaging waste reduction technology advances but faces cost barriers to widespread implementation.
Price Analysis: What You Actually Pay Per Ounce
Price point strategy becomes crystal clear when you calculate real costs.
| Size Category | Typical Price | Cost Per Ounce | Efficiency vs. Regular |
|---|---|---|---|
| 1 oz (vending) | $1.25 | $1.25 | -227% (much worse) |
| 2 oz (grab-and-go) | $1.50 | $0.75 | -96% (worse) |
| 8 oz (regular) | $3.49 | $0.44 | Baseline (0%) |
| 11 oz (family) | $4.29 | $0.39 | +11% savings |
| 16 oz (party) | $5.49 | $0.34 | +23% savings |
| 24 oz (bulk) | $6.99 | $0.29 | +34% savings |
Vending machine convenience costs you an extra $0.81 per ounce. Over a year of daily vending purchases (250 work days), that’s $202.50 wasted versus buying regular bags.
Marketing strategy in snacks exploits convenience pricing. Those single-serve bags require identical manufacturing cost per ounce as family sizes.
The 300% markup purely reflects “I want chips right now” desperation.
Practical Shopping Strategies Using Size Knowledge
Chip bag size comparison chart thinking transforms how you shop.
Optimal Size Selection by Situation
Daily snacking? Buy 8 oz bags for freshness and reasonable portion control. Hosting 10 people? Two 16 oz bags provide variety plus backup. Road trips demand 2 oz bags no waste, easy disposal.
Strategic decision-making accounts for consumption patterns. If you’ll actually eat 16 oz within three days, buy the party size.
If chips go stale before finishing, stick with regular despite higher per-ounce costs.
Party Planning Math
Formula: (Number of guests × 1.5 oz per person) = Total ounces needed
Add 20% for variety across 3-4 flavors. Party size becomes cost-efficient at 8+ guests. Below that threshold, multiple regular bags offer better value through variety.
Storage Dimension Planning
Standard pantry shelves run 10-12 inches deep perfect for family size bags laying flat. Cabinet door organizers max out at 4″ depth, limiting storage to regular bags. Drawer storage fits 16 oz bags diagonally in standard 14″ deep drawers.
Clip sealing adds 1-2″ to effective height of opened bags. Plan shelf spacing accordingly or bags won’t fit back after opening.
The Future of Chip Bag Sizes
Packaging innovations promise smarter sizing ahead.
Smart packaging integration brings QR codes linking to freshness data. NFC tags enable inventory tracking.
Augmented reality lets you preview actual chip volume before purchase ending the air-to-chip confusion.
Customization trends emerge through vending machines dispensing custom portion sizes. In-store fill stations with reusable containers test at Whole Foods locations.
Subscription services offer personalized bag sizes based on consumption history.
Regulatory pressure builds for standardization. Proposed FDA guidelines demand clearer portion labeling.
International harmonization efforts through ISO standards could revolutionize packaging standardization globally.
Measuring Chip Bags: Your Complete Guide
Chip bag measurements matter when planning purchases, parties, or just satisfying curiosity.
Standard sizes progress logically: 1 oz → 2 oz → 8 oz → 11-13 oz → 16 oz → 24+ oz. Manufacturers skip certain sizes due to production inefficiency. That’s why 5 oz and 9 oz bags barely exist.
Chip bag dimensions chart thinking helps visualize purchases. Regular bags match magazine dimensions.
Family sizes equal wine bottle height. Party sizes approximate laptop footprints.
Price efficiency peaks at party size (16 oz) with 23% savings versus regular bags. Environmental impact favors larger sizes too 65% less packaging waste compared to equivalent single-serves.
Your hand measures surprisingly well. Span equals 8-9 inches. Finger width hits 0.75 inches.
Everyday objects (dollar bills, credit cards, smartphones) provide instant references.
The air inside serves legitimate purposes despite appearances. Nitrogen cushioning prevents crush damage and extends shelf life from days to weeks.
Legal requirements limit “functional slack fill” to necessary protection levels.
Understanding chip bag capacity transforms shopping from guesswork into strategy.
Buy right-sized bags for actual consumption. Calculate true per-ounce costs. Plan party quantities using the 1.5 oz per person formula.
Snack packaging sizes reveal careful engineering, psychological manipulation, and economic optimization.
Every dimension serves multiple purposes. Now you know exactly what you’re buying and paying for when you grab that next bag of chips.
Read more knowledgeable blogs on Pun Dazzle

Philipp Engel is a passionate writer and pun lover dedicated to spreading laughter and joy through words. As the creator and author of the website Philipp Engel, he delivers a delightful mix of puns, jokes, and playful humor that entertains readers of all ages. With a sharp wit and a deep love for language, Philipp aims to brighten every visitor’s day with clever wordplay and a smile, making humor a universal language that connects people everywhere.